2D Random Walk With Python
As a continuation of the previous post on random walks, we will see how we can generate two dimensional random walks in python.
The theory.
The procedure to generate a two dimendional random walk will be similar to the one for the simple one dimensional random walk with few adjustments. In the one dimensional random walk we had only 2 possible outcomes, with equal probabilities, we could either go forward or backwards. In the two dimensional walk, we now have 4 possible outcomes 2 for each dimension.
So we now need to consider 4 possibilities, each with 25% chance. Those are a step forward in the X-axis, a step backwards in the X-axis, a step upwards in the Y-axis and a step downwards in the Y-axis. The formal definition of this 2D-random walk follows the same logic as the 1D-random walk but this time we have pair of points instead of a single point.
The code.
To begin, as before, we create a file named 2D_random_walk.py and import the necessary libraries.
import numpy as np
import matplotlib.pyplot as plt
Then we create an two empty lists named x and y to represent our two dimensions, which we will use to store each of our data points and initialize it at 0.
x=[0]
y=[0]
The next step is to choose the number of steps we want our walk to run for, in this example we choose 1000, and generate that much random integers that are either 0, 1, 2 or 3 to simulate the 25% chance.
steps = 1000
probability = np.random.randint(0,5,steps)
Then we are ready to create our Random walk, we will loop through our random number list and we check if the number at each time step is one of our 4 possible outcomes. If the number is 0 we will add 1 to our previous x data point else if the number is 1 we will subtract 1 from our previous x data point, if the number is 2 we add 1 to our previous y data point and if is 3 we subtract 1 from our previous y data point. Each time we don’t add or subtract from one of our x or y data point we append to the list the previous one to indicate that there was no change.
for p in probability:
    if p == 0:
        x.append(x[-1]+1)
        y.append(y[-1])
    elif p == 1:
        x.append(x[-1]-1)
        y.append(y[-1])
    elif p == 2:
        y.append(y[-1]+1)
        x.append(x[-1])
    elif p == 3:
        y.append(y[-1]-1)
        x.append(x[-1])
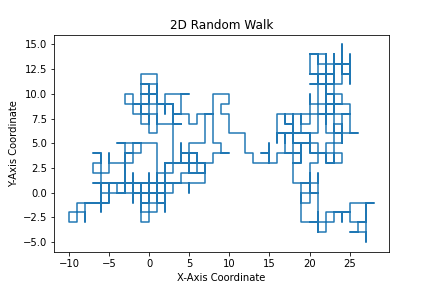
And finally we can visualize our walk by plotting the pairs with matplotlib.
plt.plot(y,x)
plt.title('2D Random Walk')
plt.xlabel('X-Axis Coordinate')
plt.ylabel('Y-Axis Coordinate')
plt.show()
The full code for this article can be found at github